
Summary
Scottish Pollutant Release Inventory 2024
An Official Statistics Publication for Scotland
Published on 30th September 2025
Key information for 2024
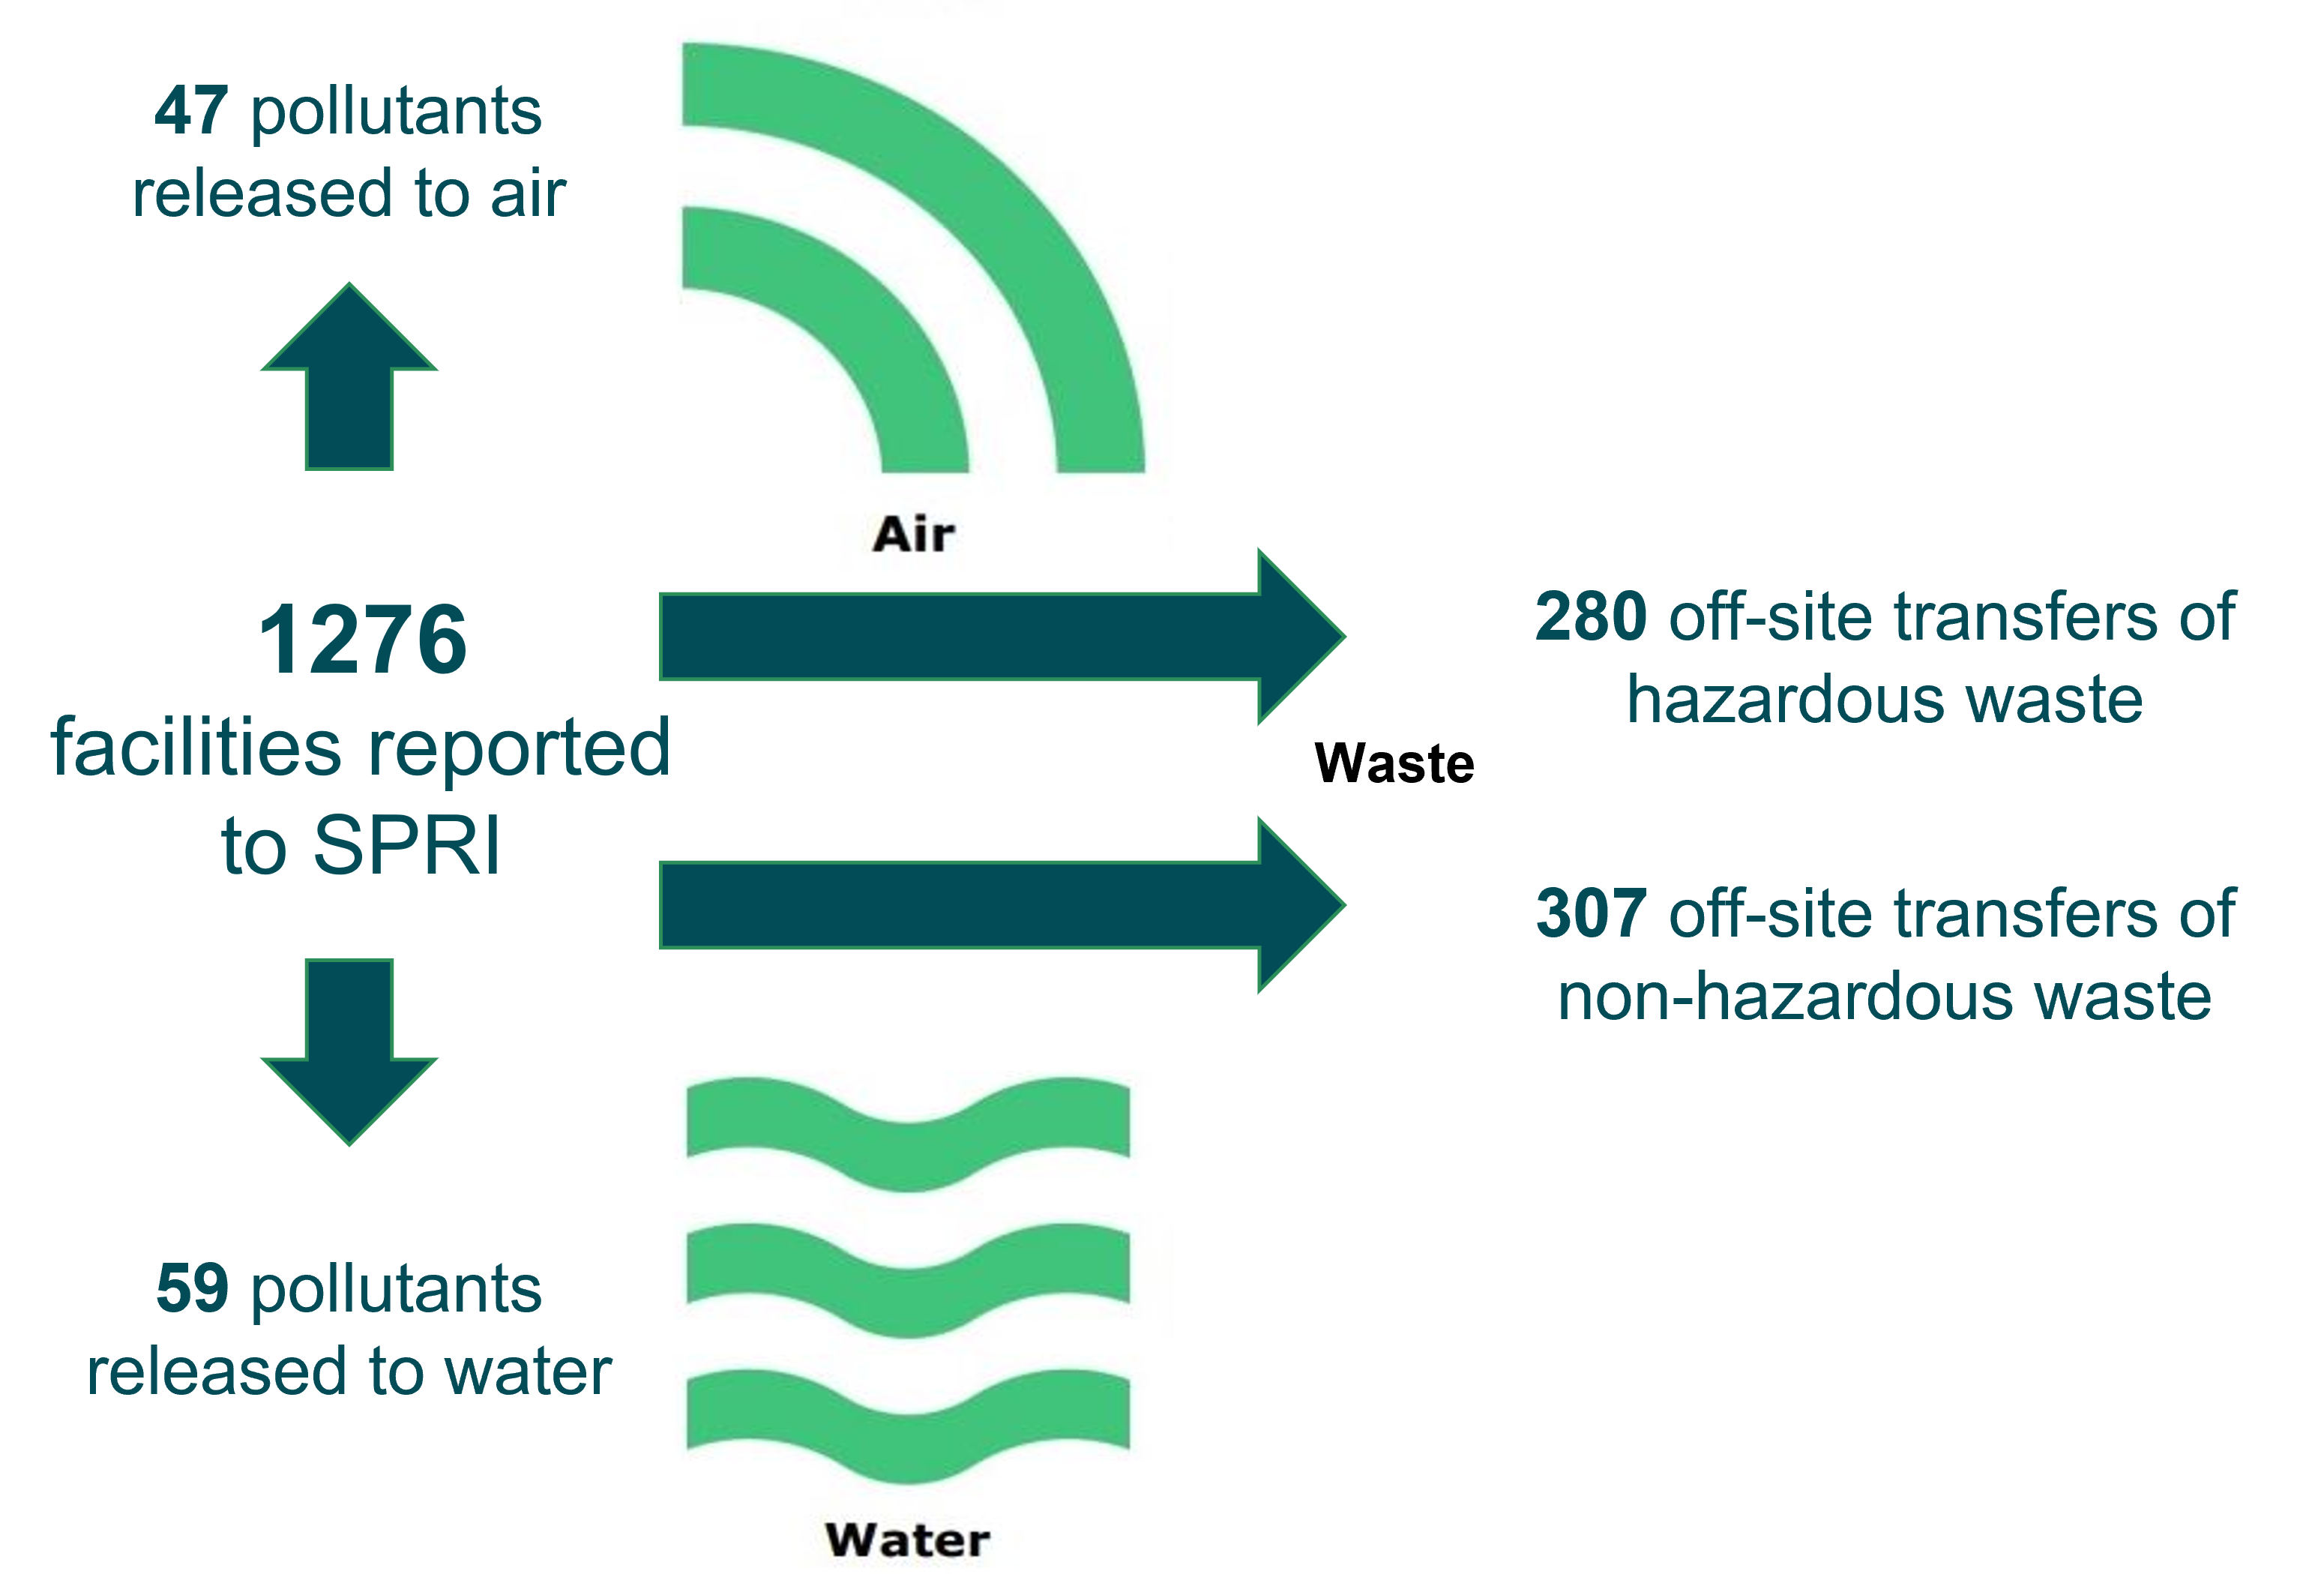
1,276 industrial facilities regulated by SEPA across Scotland reported emissions of 47 pollutants to air, 59 pollutants to water, 280 off site transfers of hazardous waste and 307 off site transfers of non-hazardous waste.
The overall global warming potential of greenhouse gas emissions from the SEPA-regulated industrial facilities were estimated to be 9.32 million tonnes carbon dioxide equivalent (MtCO2e). Emissions decreased by 3.85% (0.37 MtCO2e) compared to 2023.
Greenhouse gas emissions
Emissions of four individual greenhouse gases (carbon dioxide, methane, nitrous oxide and sulphur hexafluoride) and two groups of greenhouse gases (hydrofluorocarbons and perfluorocarbons) are reportable to SPRI.
These gases are weighted using Global Warming Potentials (GWP) to express emissions in terms of carbon dioxide equivalent (CO2e). See the Methodology section for how GWP is calculated.
The overall GWP of greenhouse gas emissions from the SEPA-regulated industrial facilities which report to SPRI (measured as carbon dioxide equivalent (CO2e)) decreased by 3.85% between 2023 and 2024. The long-term trend since 2007 has been steadily downward, indicating efforts to reduce emissions over time.
Long term trends
Figure S1 shows the GWP of carbon dioxide, methane and other greenhouse gases (nitrous oxide and fluorinated gases) total emissions from SPRI since 2007.
Overall greenhouse gas emissions have shown a sustained long-term decline over the period 2007 to 2024, with year-to-year variations reflecting production outputs. Total greenhouse gas emissions decreased by 67.6% compared to 2007, falling from approximately 28.7 MtCO2e in 2007 to 9.32 MtCO2e in 2024.
Emissions of carbon dioxide fell by 67.2% over the period, dropping from 26.5 MtCO2e in 2007 to 8.72 MtCO2e in 2024. Although there were occasional increases (most notably in 2022, after COVID restrictions were lifted), the overall trend has been steadily downward, with the sharpest year-on-year decline occurring between 2015 and 2016 (-28.3%), following the closure of the largest coal-fired power station in Scotland.
Other greenhouse gas emissions fell by 72.5% over the reporting period, from 2.18 MtCO2e in 2007 to 0.60 MtCO2e in 2024 (Figure S1). Methane and nitrous oxide emissions dropped by 73.6% and 79.0%, respectively.
Sulphur hexafluoride, hydrofluorocarbons (HFCs) and perfluorocarbons (PFCs) are fluorinated greenhouse gases (known as ‘F-gases’) which are powerful greenhouse gases that can contribute to climate change.
Emissions of HFCs decreased by 64.8%, from 0.02 MtCO2e in 2007 to 0.007 MtCO2e in 2024 (Figure S3). After a peak in 2021 due to a large accidental release, emissions of HFCs have declined due to tighter controls on their use as refrigerants. Emissions of PFCs showed more fluctuations over the same period but decreased overall by 50.4%, from 0.08 MtCO2e in 2007 to 0.04 MtCO2e in 2024. Unlike most other greenhouse gases, emissions of sulphur hexafluoride did not follow a consistent downward trend during this period (Figure S4). Although emissions fell initially, they rose again in later years, with a 2024 value of 0.01 MtCO2e, more than three times the 2023 level. This recent increase is attributable to the contribution of a single facility, indicating a localised source rather than a sector-wide trend. Sulphur hexafluoride emissions are significantly lower compared to carbon dioxide, methane and nitrous oxide, accounting for only the 0.13% of the total greenhouse gas emissions in 2024.
Figure - GWP
Table - GWP
Note
Due to rounding, the percentages reported in the text may differ slightly from the values obtained when exporting data from this figure.Figure - GHG normalised against 2007
Table - GHG normalised against 2007
Figure - GWP other GHGs
Table - GWP other GHGs
Figure - F-gas normalised against 2007
Table - F-gas normalised against 2007
Changes since last year
The overall global warming potential of greenhouse gas emissions from the SEPA-regulated industrial facilities which are required to report to SPRI (measured as kilograms of carbon dioxide equivalent (kg CO2e)) decreased by 3.85% between 2023 and 2024.
Figure S5 shows the global warming potential of emissions by industry sector for 2023 and 2024. For reference, figures for the three F-gases are provided in Figure S6.
Figure - GWP by industry sector
Table - GWP by industry sector
Figure - GWP F-gas by industry sector
Table - GWP F-gas by industry sector
Notes on year-to-year variation in greenhouse gas emissions
In 2024, the overall global warming potential of greenhouse gas emissions from the SEPA-regulated industrial facilities which are required to report to SPRI was estimated to be 9.32 million tonnes carbon dioxide equivalent (MtCO2e). This is 3.85% lower than the 2023 figure of 9.69 MtCO2e (-0.37 MtCO2e). Carbon dioxide accounted for 93.6% of the total GHG emissions (8.72 MtCO2e). Other greenhouse gases constituted smaller proportions with methane accounting for 5.61%, nitrous oxide for 0.18%, hydrofluorocarbons for 0.08%, perfluorocarbons for 0.43% and sulphur hexafluoride for 0.13%.
Carbon dioxide
Overall, carbon dioxide emissions decreased by 3.73% in in 2024 compared to 2023. This marks the lowest reported carbon dioxide total emissions reported to SPRI in the current time series, representing a 13.7% reduction from 2021 and a 18.1% reduction from 2020. The composition of the top ten carbon dioxide emitting facilities in 2024 remained largely consistent with the previous year, with several facilities retaining their positions. Emissions of carbon dioxide from these top ten facilities collectively fell by 7.87% between 2023 and 2024. The five largest facilities, each releasing over 0.4 Mt of carbon dioxide, had significant reductions compared to their 2023 levels.
Most sectors have reduced their emissions of carbon dioxide except the Waste and wastewater management sector, the Paper and wood production and processing and Metal sectors which saw increases of 6.85%, 3.53% and 2.08% respectively, compared to last year. The Energy sector saw a 7.80% decrease in carbon dioxide emissions.
The Chemical industry (-7.94%) and Mineral industry (-5.60%) sectors have decreased their emissions compared to the previous year. The most significant reduction was in the Food and Drink sector, with emissions falling by 23.1% with only three facilities reporting carbon dioxide values above the reporting threshold (ART) in 2024. Intensive livestock production and aquaculture and Other activities sector did not have any reported emissions of carbon dioxide in 2024, as per the previous year.
Methane
Overall methane emissions decreased by 5.31% between 2023 and 2024. The methane emission value in 2024 (0.52 MtCO2e) is the lowest value ever reported in current time series and 2024 emissions are 22.4% lower than the average of the past five years. Emissions of methane from landfills made up 76.8% of the total methane emission in 2024. It is important to note that landfill data is often modelled.
Nitrous Oxide
In 2024, four facilities reported nitrous oxide emissions compared to two facilities in 2023. Overall, emissions in 2024 are 80.5% higher than 2023 and 4.20% above the average of the past five years.
Hydrofluorocarbons (HFCs)
Four facilities reported emissions of HFCs above the reporting threshold (100 kg) in 2024 and all were accidental emissions. The 2024 total release of 0.01 MtCO2e is 44.4% (0.01 MtCO2e) lower than 2023, 81.0% lower than the average for the past five years and it is the lowest emissions value of HFCs ever reported.
Perfluorocarbons (PFCs)
Emissions of PFCs decreased by 29.2% between 2023 and 2024. Three facilities reported emissions PFCs in 2024, the same number as in the previous year. The dominant facility, which accounts for 87.8% of the total emissions, reported a 27.3% decrease from 2023.
Sulphur Hexafluoride (SF6)
Two facilities reported emissions of sulphur hexafluoride in 2024. One facility accounted for 96.1% of the total, with emissions at that facility increasing by 300% compared to 2023. This led to a 258% overall rise in sulphur hexafluoride emissions between 2023 and 2024.
Total emissions for 2024
Summary data for all “above reporting threshold” (‘ART’ – see Notes on total emissions data (Methodology section)) pollutant emissions to air and water is provided in the tables below:
Table S7: Total ART emissions to air by pollutant and relevant industry sector for 2024.
Table S8: Number of facilities reporting ART emissions to air, and percentage of total ART emissions released, by relevant industry sector and pollutant for 2024.
Table S9: Total ART emissions to water by pollutant and relevant industry sector for 2024.
Table S10: Number of facilities reporting ART emissions to water, and percentages of total ART emissions released, by relevant industry sector and pollutant for 2024.
Emissions to air
Emissions to water
Waste transfers for 2024
Data on offsite transfers of waste by industry sector, waste type (hazardous, non-hazardous) and management method (recovery, disposal) is shown in Table S11. For more information on the reporting of offsite transfers of waste in SPRI, see the Methodology section.